Current genetics
Multimedia E-textbook of medical biology, genetics and genomicsGenetic Cartography
Linkage and map distance
In case of classical dihybridism of Gregor Mendel, the different alleles of two genes segregate independently. Backcross in dihybridism is recapitulated on Fig. 8.1.
This is obviously true for loci localized on different chromosomes (I use the term locus instead of gene deliberatively, as many loci used for linkage and linkage mapping are outside genes. A typical gene is also significantly larger than interval between 2 polymorphic loci. Regarding "locus" means a place in latin, the term is suitable even for single nucleotide polymorphisms, SNPs). When, on the other hand, the loci are very close to each other, let´s say at a kb scale in mammals, the alleles of such two loci don't segregate at all, and are inherited as a fixed combination or a haplotype (a haplotype is a combination of particular alleles at two or more loci localized at one chromosome, a genotype of an individual across particular chromosomal region is composed of two haplotypes). This situation is also called "complete linkage" (Fig. 8.2). However, due to meiotic crossing-over and recombination, a continuum between these two marginal situations exists. This "incomplete linkage" is depicted on Fig. 8.3. We observe 4 genotypic and phenotypic groups again, similar to "classical dihybridism", but the odds (segregation ratio) for the groups are no longer 1:1:1:1, since the relative amount of the individuals carrying genotypes which arose by crossing-over (the recombinants) is lower than the amount of individuals bearing the original parental chromosomes. In general, we can assume that the closer the two loci are on the chromosome (i. e. in terms of DNA molecule length, in bp, or kb or Mb) the more obvious tendency to be inherited together, which manifests by lower relative amount of recombinants.
Therefore, we can measure how often the loci are inherited together or how often are separated by crossing-over and calculate thus "linkage distance". The linkage distance can be best inferred from an experimental backcross. Example data are given in Fig. 8.4, based on data of Herron et al., 2005. A mouse autosomal dominant mutation "repeated epilation" causing skin abnormality, can be mapped to mouse chromosome 4 by defining linkage to a microsatellite DNA marker "D4Mit204". a2 allele of the marker goes with the affliction. There is 10+19 = 29 recombinants and 318+285 = 603 nonrecombinants.
The linkage distance in backcross is measured as the recombination fraction (θ), the fraction or percentage of recombinants among all the offspring:
(8.1)
![]()
in our case
![]()
Minimum recombination fraction is 0 - i.e. there are no recombinants, maximum is 50% in case the genes are actually on different chromosomes, or at the same chromosome, but very distant. The 50% maximum is explained by the fact, that 2 duplicated chromosomes (4 DNA molecules) undergo the process of crossing-over in meiotic prophase, so even in case there is always a crossing-over between two loci, 2 strands of the tetrad are still nonrecombinant (see more detailed explanation, accounting for double recombinants in Strachan and Read, at http://www.ncbi.nlm.nih.gov/books/bv.fcgi?rid=hmg.figgrp.1383).
Mapping function
In linkage mapping, i. e. constructing maps of chromosomes based on distance and order of polymorphic markers and traits (see later, three point experiment), there can be a difficulty using the recombination fraction as a linkage metrics.. For example, consider the recombination fraction between A and B is 0,3 (30%) and between B and C 0,4 (40%). What is the recombination fraction between A and C? Certainly not 0,7, we would expect maximum 0,5 or 50%. So the recombination fractions are not additive, which is not practical for mapping purpose. Another problem of recombination fraction is, that it does not reflect chiasma interference (also discussed later). Therefore, a lot of mathematical transformations of recombination fraction were proposed, to make it additive and correct for skewed chiasma distribution. Most known are Haldane and Kosambi map function.
Haldane (8.2):
![]()
Kosambi (8.3):
![]()
Map function unit is Morgan (M) or more often centimorgan (1 cM = 1/100 M). For small values of recombination fraction (up to 0,01 or 1%), 1% of recombinants is approximately equal to 1 cM.
Linkage in cis and trans
In dihybridism, it is impossible to discriminate these two possible parental genotypes strains in the first and second filial generation:
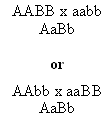
In both cases, the F1 hybrids have the same genotype.
But imagine that loci A and B are residing on the same chromosome. Then the haplotypes of first F1 hybrid will be AB/ab, but Ab/aB for the second one. And now let's cross these F1 hybrids to an aabb parental strain. It is obvious, that in the first case the nonrecombinant (paternal) combinations will be AB/ab (AaBb) and ab/ab (aabb) and the recombinants Ab/ab (Aabb) and aB/ab (aaBb), in the second case the recombinants and nonrecombinants will be reversed (compare Fig. 8.3 to Fig. 8.5). The first possibility, where the dominant alleles or the recessive alleles respectively of the two loci are on the same chromosome of the F1 hybrid is called linkage phase cis or coupling. The second case (dominant allele in locus A with the recessive in the locus B and vice versa for the second chromosome in F1 hybrid) is called linkage phase trans or repulsion.
Linkage in intercross
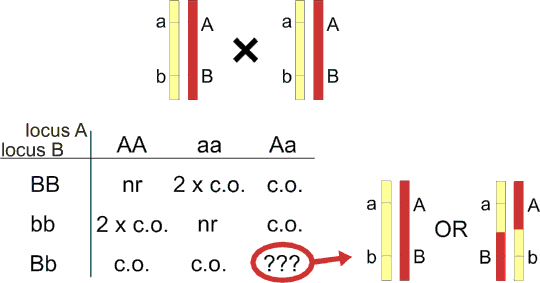
Linkage can be evaluated in intercross too. In contrast to backcross, crossing-over occurs in both F1 parents. This increases the power of linkage analysis for codominant alleles, as each F2 hybrid contains result of two informative meioses. However, even for codominant markers, there is some uncertainty (table 8.1) when both loci in a F2 hybrid are heterozygous. Fortunately, this uncertainty is low for closely linked loci. The recombination fraction is calculated as follows:
(8.4)
![]()
If some alleles are dominant, many F2 hybrids are not informative - we cannot decide whether they are recombinant or not. So linkage analysis is possible only in the informative subset of F2 hybrids. E.g. for autosomal recessive traits we can use only afflicted individuals (recessive homozygotes), which should be homozygous for closely linked loci as well. This approach is called homozygosity or autozygosity mapping.
In humans, the cross type cannot be preselected. However, pedigrees can be analyzed for linkage if the pattern of inheritance corresponds to that of backcross or intercross. Pedigrres with autosomal dominant traits are usually corresponding to backcross, those with autosomal recessive traits have frequently the intercross pattern. Families are usually small and the loci used as genetic markers are not always polymorphic (see in the polymorphism section). Therefore more families are grouped together to increase the statistical power and more polymorphic markers are tested to have better chance for informative genotypes.
LOD score
To estimate linkage, it is very important to discern between random fluctuations of number of individuals in each offspring group and true linkage. Since the necessary statistical testing is a little bit different from other commonly used statistical methods, I will focus on it in a greater detail. LOD score, the most commonly used statistics/metrics is based on the direct comparison of probability of null hypothesis, stating that there is no linkage (recombination fraction 1/2), with the alternative hypothesis, claiming there is linkage with a certain recombination fraction θ. How we do that? We calculate the exact probability of obtaining our results under assumption of alternative (θ<1/2) and null hypothesis (θ=1/2), P(θ) and P(1/2) respectively. By dividing P(θ) by P(1/2), we obtain odds for the linkage. For simplicity, a logarithm with base 10 is used most often (logarithm of the odds ratio = LOD score). For a backcross, the formulas for P(θ) and P(1/2) are relatively simple. Consider a backcross AaBb x aabb in cis phase. We have r recombinants from N all individuals. From it follows d = r/N is the recombination fraction. Let's assume then, for simplicity, that d is the best approximation of the real recombination frequency θ (we already made this assumption in the equation 8.1, but it is obvious that especially in small samples this must be taken with caution). Probability of an individual to have a recombinant genotype Aabb is d/2, same for the other recombinant aaBb. A nonrecombinant genotype AaBb would have the probability (1-d)/2, the same for the aabb. The probability of our data will be the probability of concomitant occurring of r recombinants, each with probability d/2 which is together (d/2)r, and N-r nonrecombinants each with probability (1-d)/2, together ((1-d)/2)N-r. Therefore
P(θ) = P(d) = (d/2)r((1-d)/2)N-r
If the zero hypothesis is valid, and there is no linkage, then each genotype has equal probability, which gives 1/4 for each, regarding the 4 genotypes we observe. P(1/2) is the product of these likelihoods for N individuals:
P(1/2) = (1/4)N
The LOD score is thus (adjusted)???:
(8.5)
![]()
In general, there can be situations, where it is rational to admit, that d as a θ estimation is not appropriate - especially in small human pedigrees. In this case it is possible to find a better θ estimation as a d value which gives local maximum of LOD score. (for the backcross described above, however, the LOD maximum is exactly at d=r/N).
For our example with skin abnormality, LOD score is:
![]()
LOD = 242,4
When we have the LOD score, the next step is to make the actual decision, if to admit the linkage eventually or not. The probability of null hypothesis will never be zero so there is always some chance that truly unlinked loci would look linked. So the question is, how reasonably small the probability of null hypothesis must be to convince us to exclude null and admit alternative hypothesis. And this we have to choose deliberatively, providing we know, that there is some low chance to be mistaken. In linkage analysis, LOD more than 3 is regarded significant, which means the linkage is 1000 (e+03) times more probable than no linkage. It is also frequently important to exclude linkage, wherever possible to limit the list of candidate genes for further studies. For exclusion, LOD score less than -2 is required (no linkage is 100 times more probable than linkage). Our example, with high number of individuals, leads to extreme LOD score 242,4 so there can be no doubt of linkage. But in human pedigrees, the situation is different. Even relatively large family, as shown in Fig. 8.6A, with closely linked loci (only one recombinant) is not enough to prove linkage. And the problem is even worse, if the family has only two informative generations, as in Fig. 8.6B, because the phase of the linkage is unknown, and both possibilities must be taken into account for LOD score calculations.
Ordering of loci and three-point linkage experiment
Linkage can be exploited in order to find a gene mutated in a genetic disorder, both in experiment and in the human pedigrees. In this situation, one locus is represented by the disease phenotype (or lack of it) as a polymorphic trait, which is tested for linkage with a polymorphic DNA marker (e.g. Fig. 8.6) or , in practice, with a set of polymorphic DNA markers distributed along all chromosomes. To find such a linkage (disease-DNA marker) may be helpful - Since the human genome sequence is known with few exceptions, the position of a DNA marker is known too - and if there is a strong linkage between this marker and the disease, the disease gene is probably not far away. Thus you can look around the marker for candidate genes and test them for mutations, even being totally ignorant about the disease pathogenesis and possible functions of the mutant gene, only knowing its position on chromosome. This method is thus dubbed "positional cloning". This simple disease - marker linkage has one obvious disadvantage - it would be advantageous to know only that the disease locus is close to a chromosomal point, but an exact DNA segment, where the disease locus must be placed. Then the success in finding the mutation is theoretically inevitable, e.g. by sequencing the whole segment from an affected individual(s) we must find the mutation. This task can be done easiest by loci ordering - if we can perform the linkage analysis in such a way that we obtain an order of loci linked together then the disease locus should fall between two marker loci - and we have our segment.
The minimum number of loci for ordering is of course 3. So we will perform a "three-point linkage experiment". Consider three loci 1, 2, 3 with the respective order. The crossing-over can take place between 1 and 2 or between 2 and 3 or there can be two crossing-overs at a time, separating the allele at locus 2 from 1 and 3. The probability of such double recombination will be relatively small - theoretically a product of the two probabilities for a single crossing-over. If the distance 1-2 is e. g. 5 cM and 2-3 10 cM, the product is 0.05x0.1=0.005. In figure 8.7 you can see a backcross (in the rat), where a gene H with a mutant allele causing male infertility (h) segregates with two microsatellite markers A and B. There are 8 genotype groups, which we merge into 4 categories. You see that in addition to nonrecombinants, there are 3 recombinant groups. In the group ABh or abH (the gene H is recombined from A and B), there is only 1 individual. That must be the double recombinant category, so the order is A-H-B or equal B-H-A. When the physical position of markers A and B on the chromosome is known, one of the genes which are in the genomic DNA between A and B must be the mutant H.
The right order was determined by satisfying the condition of minimum double recombinants. This approach can be extended to any number of loci. The ordering seems to be more complicated now. However, even at three-point stage, the right order means minimum double recombinants and consequently minimum total length of the linkage map. The right map is therefore the shortest one - and the search for such a map can be easily automated for multilocus mapping. Example of such results are shown in Fig. 8.7C for mapping of mouse limb and infertility mutant luxoid. Note that the segment of the chromosome is so tiny, that there is no double recombination. Nevertheless, the locus order determined by the authors (Buaas et al., 2004) is the best possible (not counting the possibility to turn the whole map upside down).
Now, when you look back at the example in Fig. 8.7 A and B, the probability of recombination between A and H and between H and B, the double recombination, presumably co-occurence of two independent recombinations should have probability equal to the product of the single recombination probabilities. In our case, it is.0,127 x 0,088 = 0,0112. However, the real frequency is lower, 0,0029. This is a common observation and was confirmed at whole-genome scale. It seems from these data, that a crossing-over occurence negatively interferes with forming a second crossing-over in its neighbourhood. This phenomenon is called interference. The extent of interference can be calculated as a coeficient of interference, telling us how large fraction of possible double crossing-overs was inhibited by formation of the first crossing-over.
(8.6)
![]()
The (actual double recombinant fraction)/(expected double recombinant fraction) ratio is called coeficient of coincidence (coc). For our example i=0,74 and coc=0,26. So here we have only 26% of expected double crossing-overs, in other words 74% of possible double recombinations were inhibited after the creation of the first crossing-over. Interference leads to more even distribution of crossing-overs along the chromosomes, which is probably functionally important, as, for example, chiasmata generated by crossing-overs are the points of cohesion of homologous chromosomes in meiosis and substitute there the function of centromere cohesion in mitosis. Even distribution of chiasmata may lead to less segregation errors and ensure at least one chiasma per chromosome, which is a necessary condition for proper segregation of the homologous chromosomes.
Polymorphisms
Polymorphic loci = polymorphisms have at least two different alleles in the population. Some manifest as phenotypes, but all of them are ultimatively variations at the DNA level, in the genotype. Minimal polymorphism is a SNP, single nucleotide polymorphism.
For an explanation, all people have e.g. a gene for angiotensin converting enzyme. But some people may have this gene slightly different from the others, there can be a nucleotide difference, which is translated into amino acid difference, possibly the enzyme variants have different rate of converting angiotensin I to angiotensin II which can lead to different blood pressure in the two groups of people. But be careful, this chain of cause and effect is seldom completed up to the phenotypic level. Technically, we consider a polymorphic locus only when the scarcer allele reaches frequency of 1% in the studied population. If the frequency is lower, the allele is called a rare allele. The distinction is somewhat arbitrary, but helps to simplify population and other genetic studies.
Various kinds of polymorphisms
- mendelian phenotypes
- blood groups
- serum proteins
- HLA antigens
- tandem repeats - minisatellites, microsatellites
- SNPs - RFLP and other SNPs
The amount of visible or easily detectable polymorphic Mendelian phenotypes (i. e. 2 or more distinct phenotypic Mendelian traits like flower color in pea) is limited to a few. For satisfying the need of polymorphic loci, it was necessary to inspect organism at a deeper level.
Historically, first such polymorphic loci were blood groups, highly polymorphic proteins (MN, Ss, Rh) or sugars (ABO) on the red blood cell membrane, easily detected by clotting (agglutination) of the erythrocytes by specific antibodies.
Variants of abundant serum enzymes/proteins are investigated by differences in mobility in electrophoresis.
MHC (HLA) antigens, as the most polymorphic class of proteins, are very suitable for linkage studies, but are limited to a short segment of chromosome 6, where these genes are localized. But many more polymorphisms reside and are assayed on DNA level.
VNTRs = variable number of tandem repeats are minisatellite polymorphisms which are usually assayed by Southern blot. When restriction sites flank a DNA fragment containing the tandem repeats as well as some unique sequence, a probe can be made from the unique sequence and hybridized to Southern membranes, where diffrent number of tandem repeats will translate into different electrophoretic mobility. If the probe is made from the repeat sequence, you visualize all similar minisatellites across the genome. You obtain quite a complicated pattern, which is due to high level of polymorphism unique to an individual. This fingerprinting has been used to prove identity. However, minisatellites were now almost replaced by microsatellites both as genetic markers and for fingerprinting assays.
Microsatellites (see the chapter Repetitive sequences), also known as short tandem repeats (STRs) are error prone sequences, due to unequal recombination and polymerase slippage, which change the number of repeats. However, the instability is under normal conditions detectable only over an evolutionary scale when we compare the microsatellite evolution with evolution of other sequences. This means, that over evolutionary time scale, a lot of mutations of microsatellites have accumulated in the human population, which were usually neutral (not advantageous, not disadvantageous). As a result, there are usually several alleles for a given microsatellite in human population, differing in the length of the repeat. This makes microsatellites useful genetic markers, as length of the repeat can be essayed easily by PCR amplification using primers in the unique sequence flanking the repeat and comparing length of the amplicons using gel electrophoresis. The assay for microsatellites is relatively cheap and simple, so they are widely used in linkage, association, population studies, for DNA diagnostics and for forensic applications.
The avantage of microsatellites is their high probability of being informative in pedigrees. In a pedigree, the marker is not informative if at least one parent is homozygous, or, for 1/2 of offspring, both parents heterozygous for the same allele combination. What is the probability, that a marker is informative? Let's p(i) be a frequency of allele i, p(i)2 is probability of one parent being homozygous for allele i, and 4p(i)2p(j)2 is the probability of two parents both heterozygous for alleles i and j. Then polymorphism information content (PIC) will equal:
(8.7)
![]()
For a microsatellite with 5 alleles, each with frequency 0,2, the PIC is 0,77 while for a RFLP polymorphism with two alleles, one with frequency 60% and the other 40% it is only 0,36. More information in Strachan and Read, http://www.ncbi.nlm.nih.gov/books/bv.fcgi?rid=hmg.section.1387.
The main disadvantage of microsatellites is limited possibility of multiplexing (i. e. running multiple assays in one tube). The forensic DNA assay contains 13 microsatellite (also called short tandem repeat = STR) loci (CODIS at FBI, more info at STRbase, http://www.cstl.nist.gov/div831/strbase/fbicore.htm). The multiplex processing is possible by using 4 different colors of flourescence labeled PCR primers and by scaling of the amplicons with same colour (different alleles of a microsatellite usually differ in one to few repeat unit lengths, so it is possible for a tetranucleotide repeat with 12 alleles to design PCR amplicon of 100-150 bp, and for second similar repeat 200-250 bp so no they do not overlap). Example of microsatellite sequence and electrophoretic pattern is in Fig. 8.8.
SNP (pronounced "snip")- single nucleotide polymorphism is the smallest possible genetic change, difference in only one base pair. In particular, SNP occurs when a single nucleotide such as adenine (A) is replaced by any of the other nucleotides T, C or G, in substantial fraction of studied population (>1%). Be aware, that single nucleotide means in reality single basepair in DNA, so if A is replaced by C, then T is replaced by G in the complmentary strand. It is estimated, that there is on average one SNP per 1000 bp. Most SNPs are in noncoding sequences, given the low abundance of coding sequence in the human genome, those in coding are predominantly silent (due to genetic code degeneration, they do not cause aminoacid substitutions). Some SNPs are in restriction sites - one allele forms a restriction site, while the other diverges from the consensus sequence for the restriction endonuclease cleavage. These SNPs can be assayed as RFLPs (restriction fragment length polymorphisms) by Southern blots of DNA digested by the respective endonuclease with a labeled probe; or by PCR amplification with primers flanking the variable restriction site and digestion of the PCR product (Fig. 8.9A). Not all SNPs lie in restriction sites. Therefore, different methods are used, based on hybridization of DNA to oligonucleotides specific for each variant or on single-step DNA polymerase extension of a primer localized next to the variant place by labeled nucleotide. Employing DNA microarrays for analysis can efficiently multiplex these assays. Current state-of-the-art 500k GeneChip array from Affymetrix can determine 500 000 SNPs on two 250k chips (see the principle in the Fig. 8.9B describing the older 100k set). This assay is based on measuring hybridization strength of oligonucleotides matching both sequence variants, compared to hybridization to deliberatively mismatched oligonucleotides as a control. The disadvantage of SNPs is the limited amount of alleles in the population. Theoretically, there can be maximum of 4 alleles per SNP, but usually only two exist. The polymorphism information content for a single SNP is therefore relatively low. Grouping SNPs together and analysing haplotypes instead of single SNPs can mend this. So you need several SNPs to get the same information as for one microsatellite, but parallel processing of SNPs is more straightforward. SNPs represent significant contribution to the human genetic variation. A part of this variation can be functional - SNPs in coding sequences that change aminoacids or SNPs in regulatory sequences. A large international project, the HapMap (http://www.hapmap.org/index.html) was launched with the ambitious plan to capture most of the diversity by typing diverse populations for SNPs. As an illustration, recently the HapMap data contributed to elucidation of the genetic change behind the light skin pigmentation in Europeans (Lamason et al., 2005).
Reference linkage maps for humans
3 whole genome linkage maps are available for humans. All are accessible from the human genome resources at NCBI, http://www.ncbi.nlm.nih.gov/genome/guide/human/. The Genethon and Marshfield maps are based on CEPH families (Centre d'Études du Polymorphisme Humaine in Paris), the deCODE map on 146 families from Iceland.
The relationship of linkage map and DNA sequence
The order of loci determined by linkage should be always identical to the order of the loci in the DNA sequence along the chromosome. So wherever there is a discrepance between human genome sequence and linkage map, there is an error in the linkage map, in the genome sequence or in both. Because linkage and DNA sequence assembly are independent, linkage may be used this way to resolve errors in DNA sequence of the human genome. The relationship between map distances in cM and DNA sequence is, on the other hand, not simple. Whole genome comparison of deCODE map and public human genome sequence results in average estimation 1,13 cM/Mb (1,13 centimorgans per megabase of DNA), but the range is varies widely more than one order of magnitude. The current model for recombination is alternating recombination hot spots and deserts along the chromosome. There are some general rules: recombination rate is larger in women, the variability of recombination rates is also larger in women, typical recombination deserts are centromeres and the recombination rate tends to increase towards telomeres. Typical recombination hot spots are in the pseudoautosomal regions on tips of both arms of X and Y chromosomes, where an obligate chiasma must occur during male meiosis to ensure proper segregation of X and Y chromosomes into spermatids. With the HapMap project we should gaininsight into the fine recombination structure of chromosomes, especially sharing SNP haplotypes which were not broken so far by recombination in human populations (i.e. are in complete linkage).
Classical application of linkage in medicine - Indirect DNA diagnostics
Linkage can be used in DNA diagnostics. When we do not know the actual genetic defect underlying Mendelian disease or if great number of diverse mutations in the disease gene exist, one can still consult families in risk, provided we know the appoximate chromosomal localization of the causal genetic defect. We can simply use a polymorphism occurring at that place of the genome, type the healthy as well as afflicted persons in the family and try to deduce, which allele of the polymorphism is linked to the disease allele and predict thus the genotype in the disease locus and evaluate the risc in prenatal or presymptomatic or to identify carriers. We can use effectively even quite distant polymorphic markers. Consider for example an autosomal dominant illness and polymorphism which is 1 Mb from the disease gene, typically with several other genes between these two points. Still, on average the probability of recombination would be only around 1%, so your prenatal diagnosis would be appropriate in 99% - a significant improvement over the Mendelian 50% risc. Disadvantage of the indirect method is the need of complete family, with already afflicted members. Another complication is that in each family, the disease will be in general linked to a different allele of the polymorphism (it is only linkage, not cause of the disease). Some families will be thus uninformative for a given polymorphism and will have to be screened for more polymorphic loci till we find an informative one.
Figure legends for linkage
Fig. 8.1 Dihybridism according to Gregor Mendel
For loci on different chromosomes, there are four genotypes possible in the backcross AaBb x aabb, which can be also observed on phenotypic level, both for dominant/recessive and codominant alleles. Each genotype has equal probability 0.25 or 25%, the odds (segregation ratio) are 1:1:1:1.
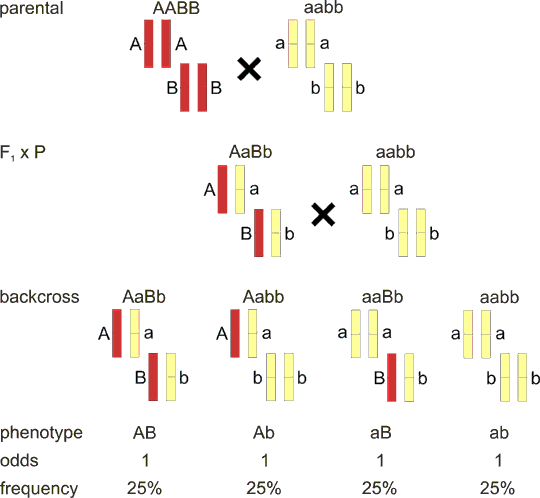
Fig. 8.2 Closely linked loci in backcross - complete linkage
Loci that are physically very close are always inherited together. The backcross has only two offspring classes with equal probability 50%.
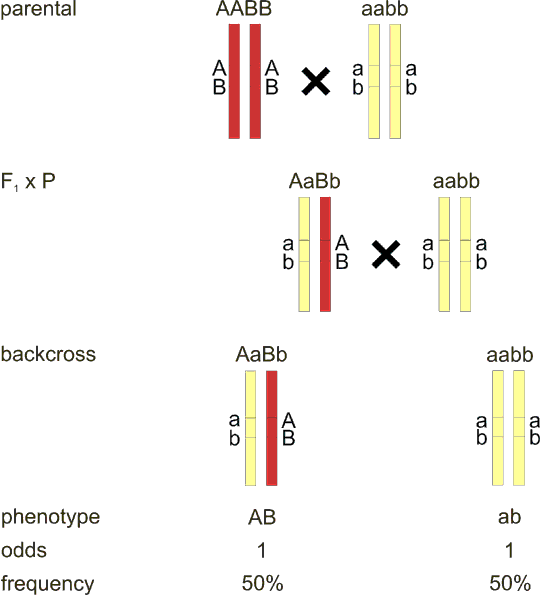
Fig. 8.3 Linkage in backcross - general model
The F1 hybrid has different alleles on each locus of the pair of homologous chromosomes, in other words each chromosome has its own haplotype. If we cross the F1 hybrid back to the parental strain, we will expect some of the offspring to inherit the yellow chromosome, and some the red one (from the F1 hybrid, there is always the yellow chromosome from the parental line). However, if a crossing-over takes place between the two loci A and B, we will have two additional offspring groups who inherit the new combination of alleles (recombinant chromosome), these offspring are called recombinants. How many recombinants are there? As shown in fig. 8.2, if the loci are very close, there can be none, and we speak of complete linkage. On the other hand, maximum number of recombinants can be 50%, as can be deduced from the fact that recombination takes place in a pair of duplicated homologous chromosomes. Note, that the situation of 50% recombinants is equivalent and cannot be discerned from the unlinked loci on different chromosomes (Fig. 8.1).
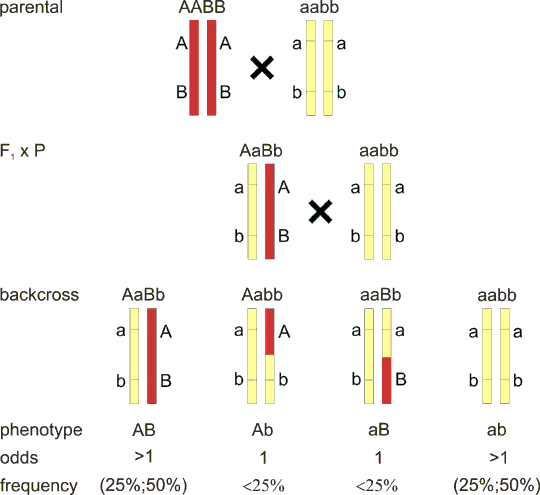
Fig. 8.4 Backcross in mice disease model
Repeated epilation (Er) is an autosomal dominant mutation resulting in abnormal epidermis proliferation and differentiation in heterozygotes. Er/Er homozygotes die in utero. To identify the underlying gene defect, linkage was tested between Er and genetic markers in the mouse genome. Here linkage is shown of Er (with mutant allele Er and wildtype - wt - allele +) to a marker D4Mit204 (DNA segment on mouse chromosome 4, Massachusetts Institute of Technology number 204, with two alleles a1 and a2). This study (Herron et al., 2005) led eventually to identification of a mutation in stratifin, and stressed importance of this regulator of cell cycle in keratinocytes in both mice and human.
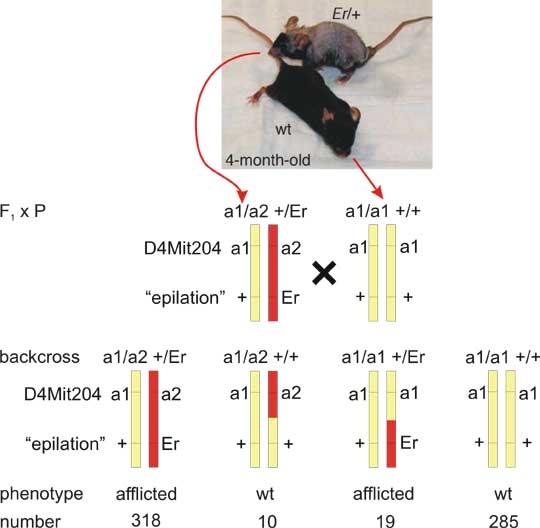
Fig. 8.5. Linkage in trans
The situation is very similar to fig. 8.3. But, in the F1 hybrid, the recessive allele a is on the same chromosome with dominant allele B (haplotype aB) and vice versa for the second chromosome. F1 hybrid has therefore haplotype set aB/Ab. Note that if you write the genotype in the classical way AaBb you miss the difference with fig. 8.3 F1 haplotype AB/ab. Offspring frequency is reversed with respect to fig. 8.3 - the nonrecombinants in fig. 8.3 are now recombinants and vice versa. General formulas for odds (segregation ratio) and genotype frequencies are added.
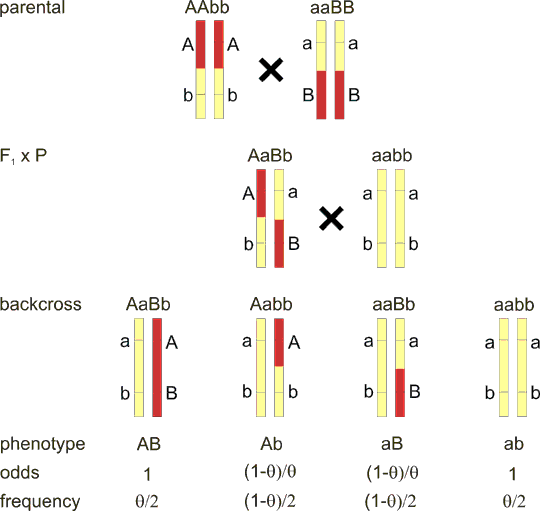
Fig. 8.6. Linkage in human pedigree
A: A family with individuals suffering from autosomal dominant disease was genotyped for a highly polymorphic microsatellite marker with alleles A1-A6. The disease in linked to marker allele A1, with except of the individual III/4, which is probably recombinant. The recombination fraction is 0.1. However, the LOD score 1.6 is not enough to prove the linkage.
B: the same family as in A, but genotypes of the grandparents are not known. This complicates the linkage analysis, because it is now not certain if allele A1 or A2 is linked to the disease. Although the IIIrd generation speaks for A1, we must calculate LOD score taking both a priori equally probable possibilities into account. The LOD score is only 1.3.
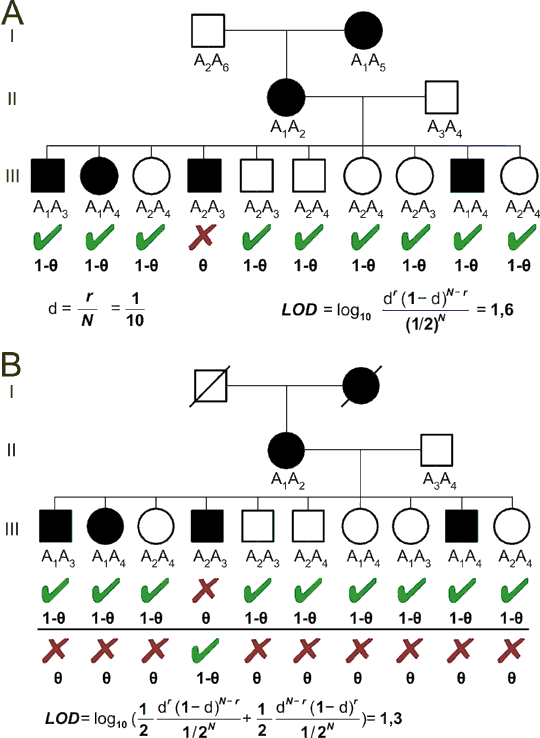
Fig. 8.7 Ordering of loci
A: rat autosomal recesssive male infertility gene h (hh homozygotes infertile, HH and Hh normal) was mapped between two microsatellite markers D10Rat34 (alleles A and a) and D10Rat57 (alleles B and b) in a backcross aabbhh x AaBbHh. Due to male infertility aabbhh had to be a female. In the table, only one haplotype is shown, the second (maternal) is always abh. The genotypes are grouped in a way that recombination between locus A and loci B+H results in genotypes aBH/abh and Abh/abh. Double crossing-over has an order of magnitude lower probability than single, so the identification of the respective offspring group is simple.
B: linkage map for data presented in A, with linkage distances in cM (centimorgans) calculated using Haldane or Kosambi map function.
C: Mapping of mouse autosomal recessive mutant luxoid (lu), afflicting limb development and spermatogenesis with respect to a set of microsatellite markers on mouse chromosome 9. Comparing the marker genotypes (white are alleles from afflicted mouse strain, black are alleles from the wildtype strain) with phenotype (+ is wildtype, lu is afflicted with luxoid) reveals that luxoid must lie between D9Mit256 and D9Mit99. The study (Buaas et al., 2004) revealed mutation in Plzf (promyelocytic leukemia zinc finger) and identified Plzf as an important regulator of stem cell proliferation.
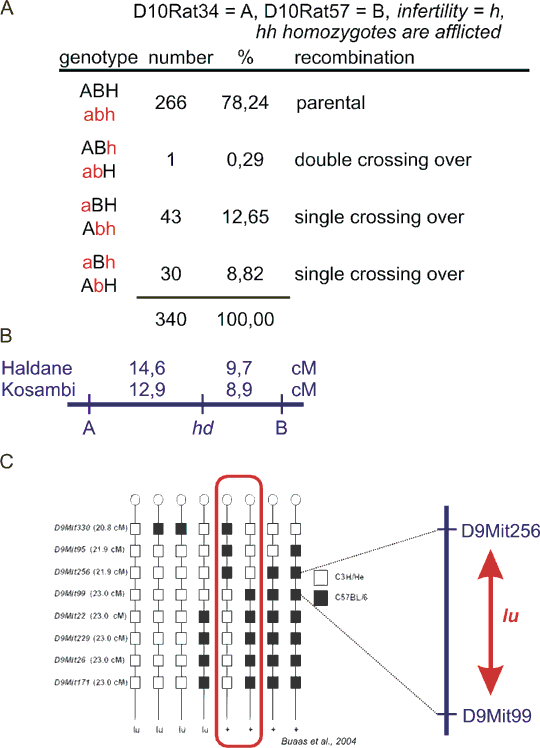
Fig. 8.8 Dinucleotide and trinucleotide repeats as microsatellite examples.
Left - microsatellites with flanking DNA sequence. The sequence of the left primer for PCR is labeled yellow; the right primer has sequence complementary to the sequence labeled in green. The microsatellite consensus is in blue. Note some degeneracy of the trinucleotide microsatellite. In the flanking sequence of the dinucelotide microsatellite there is another tertanucleotide microsatellite.
Right - examples of polyacrylamide gel electrophoresis for each microsatellite. DNA is stained with fluorescent dye ethidium bromide and photograph is taken under UV illumination. Note that especially the dinucleotide microsatellite has a quite complex pattern. This is ascribed to polymerase slippage (error during microsatellite amplification causing introduction or removal of some repeat units) and also heteroduplex formation during PCR (heteroduplexes have lower mobility especially in polyacrylamide gels).
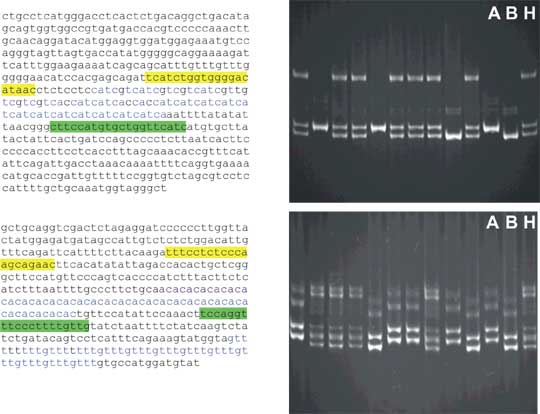
Fig. 8.9 Analysis of SNPs
A: A SNP is in the restriction site. The DNA segment is amplified by PCR with primers flanking the restriction site and the PCR product is cleaved by the appropriate restriction endonuclease. The fragments are separated by electrophoresis in an agarose gel. A and B are homozygous controls. If we label the allele with restriction site + and the allele without restriction site -, then A is +/+ control, B is -/- control, and the genotypes in the family are: 130-132 +/+, 133 heterozygote +/-, 134 is again +/+.
B: Analysis of SNPs on microarray. Genomic DNA is cleaved by a restriction endonuclease at constant sites. The fragments are then ligated to synthetic oligonucleotide adaptors and amplified by PCR (primer is corresponding to the adaptor sequence). PCR cannot amplify too long fragments, thus the complexity of the sample is reduced. The sample is then chopped to smaller fragments, labeled and hybridized to the microarray. The SNPs lie inside of the labeled DNA molecules hybridized to the array. For each SNP, the array contains a row of several covalently attached oligonucleotides that hybridize to allele A (containing e. g. guanine) and a second row hibridizing to allele B (containing e.g. adenine as the polymorphic nucleotide). The array is photographed under fluorescence microscope and genotypes inferred as shown. The array on picture is manufactured for analysis of 50000 SNPs.
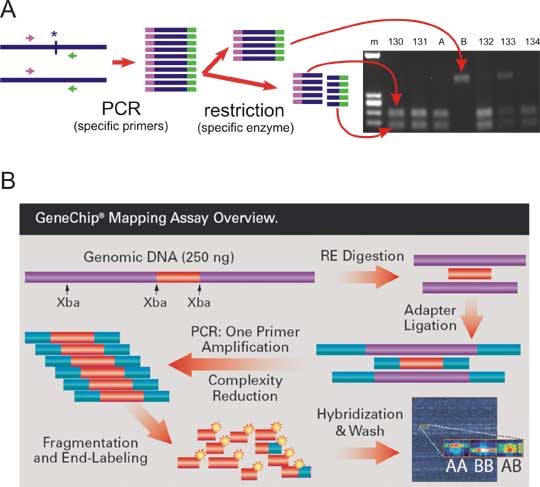
Table 8.1. Linkage in intercross
The table is made in a different way from the standard dihybridism - one locus is in the rows and the second in columns. nr=nonrecombinant (e. g. genotype AABB), c.o.=crossing-over (e.g. genotype AaBB), 2 x c.o.= crossing-over in both chromosomes (do not confound it with double recombinants in three-point experiment!). For genotype AaBb, nonrecombinant haplotype AB/ab cannot be discriminated from Ab/aB which is twice recombinant. For loci 10 cM distant, 1.2% of AaBb is twice recombinant, so this effect can be omitted in most cases.
